There are not a lot of options for group physical activity out there at moment. Many summer camps are cancelled or limited. Most group activities fall under “social” and with social distancing the norm, there are restrictions to the number of participants. In time this will change, but for now, there are limitations. Some things that we can do are walk, ride our bikes, run, roller blade, swim in home pools, skateboard. When we’re doing these activities math never comes to mind. But sometimes the distance and speed we are going does come to mind. We’ll take a a look at the math behind distance and speed in this post.
There are many cell phone apps to track information while we’re doing these activities: the distance we’ve walked, run, swam; number of steps taken; our heart rate; etc. Technology is doing everything for us. Today we’ll try and do some of these by hand or the “old fashioned” way. I’ll explain what the “old fashioned” way is below.
Let’s choose walking as our activity because it’s something that the majority of people can do. We’re going to try and see if we can calculate the speed at which we walk and if we are increasing or decreasing in speed over time.
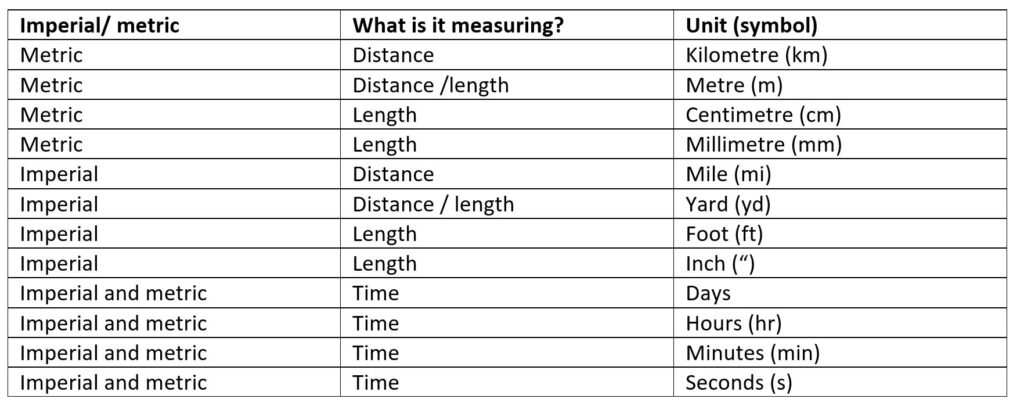
When working with numbers in “the real world” there are always units involved because the numbers usually represent something or are measuring some quantity. In the exercise we’ll do below we’ll need units of distance or length and time. Units usually come in Imperial measurements or metric measurements. The most common units of measure for distance, length and time are below:

There is a formula that converts between imperial and metric measure for length but with the internet, there are online calculators for this conversion. Below is an easy to use online calculator that allows you convert between metric and imperial length measure and vice versa.
https://www.calculator.net/conversion-calculator.html
The following are relationships that will be useful when converting between units. You’ll use these a lot during your life.

Experiment: Distance and Speed
The goal is to see how fast we walk on average. We’ll need some way of tracking our distance and time that we walk. If you have a fit bit, great. If not, there are apps. Some android apps that could work are
- Walk with Map Walk
- Strava tracker
There are many out there. Choose your favorite and keep it handy during your walk. When you go out for your walk, start your tracker and watch, if there isn’t a timer on the tracker, but more have a timer as well, and start walking. When you’re finished walking, stop the tracker and timer. Record the time you walked and the distance walked. If your tracker offers any other information like steps taken or calories burned, write that down. Create a table to record all your information. Below is a sample table.

Continue recording these measurements until you have about 10 rows of data.
Now take the distance and time columns of the first table and we’re going to make a second table. The second table is below. Put this distance and time information from the first table and put it into the first two columns of the second table.

Relationship between distance and speed
The speed is the ratio of the distance over time.
And the corresponding units are those of distance and time. So or for example.
Now we can start filling in the second table.
- How many mm in 1 cm?
- How many cm in 1 m?
- How many m in 1 km?
- How many seconds in 1 minute?
- How many minutes in 1 hour?
- How long did you walk in hours?
Example:
- How long did you walk in seconds? Example:
- How far did you walk in metres (m)?
- How far did you walk in centimetres (cm)?
- How fast did you walk in km/h?
- How fast did you walk in cm/s?
- Is there any change in your speed between all the walks you did?
Now let’s draw some graphs. You can draw them on the same graph with one colour for distance and another colour for speed.
- Draw a graph of distance (m) vs date (s)
- Draw a graph of speed (m/s) vs date (s)
- Is there any change in the speed?
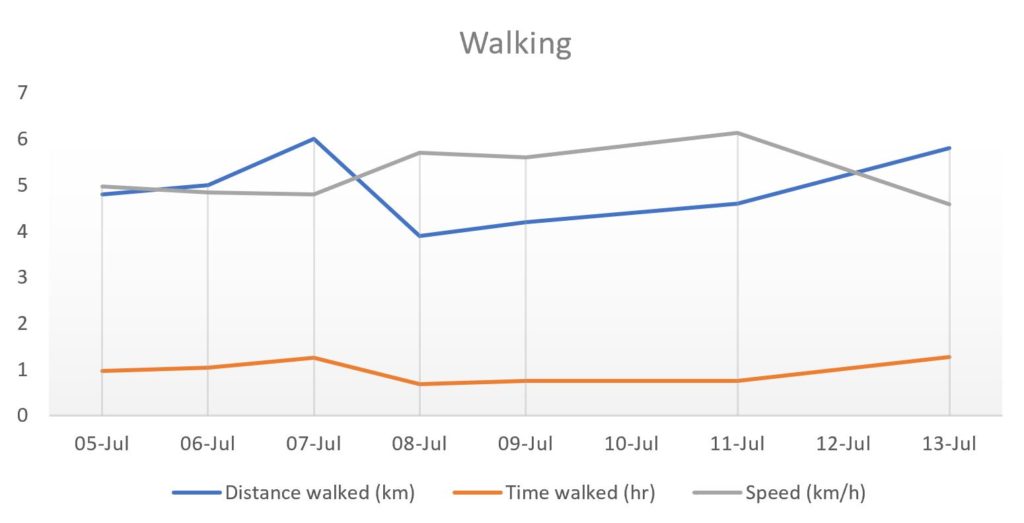
Below is an example of a graph of someone’s walking for a week.
The above can be done for cycling, skate boarding, running, swimming, canoeing, kayaking anything that involved travelling a distance over a period of time.


